Why aggregation hides risk rather than revealing it
Aggregation is supposed to be a summarization technique. In practice, when applied to risk data without care, it functions as a smoothing technique. Three programs each running at moderate risk aggregate to a portfolio that appears to be at low risk, because the moderate signals offset rather than combine. The aggregation has obscured rather than summarized.
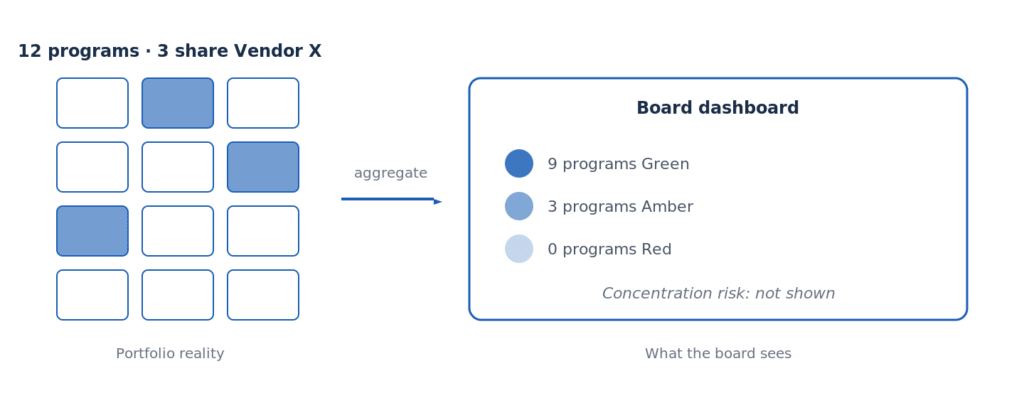
The mechanism is straightforward. Most rollup conventions average ratings or count categories — a portfolio with three amber programs and nine green programs reports “25% amber” or “stable / amber-leaning” to the board. The board sees a portfolio with some elevated risk. What the board does not see is whether the three amber programs share a critical dependency, a vendor, or a milestone — in which case the actual portfolio risk is closer to red than to amber. Aggregation by averaging loses the dependency structure that gives the risks their true weight.
The corrective is not to abandon aggregation. The board cannot review forty program-level reports. The corrective is to ensure that the aggregation method preserves the structural information that matters to a board decision — by reporting concentrations explicitly, by flagging shared critical paths, and by separating independent risks from correlated ones. A properly designed portfolio dashboard tells the board not just what the average risk is, but how the risk is distributed and whether it is correlated.
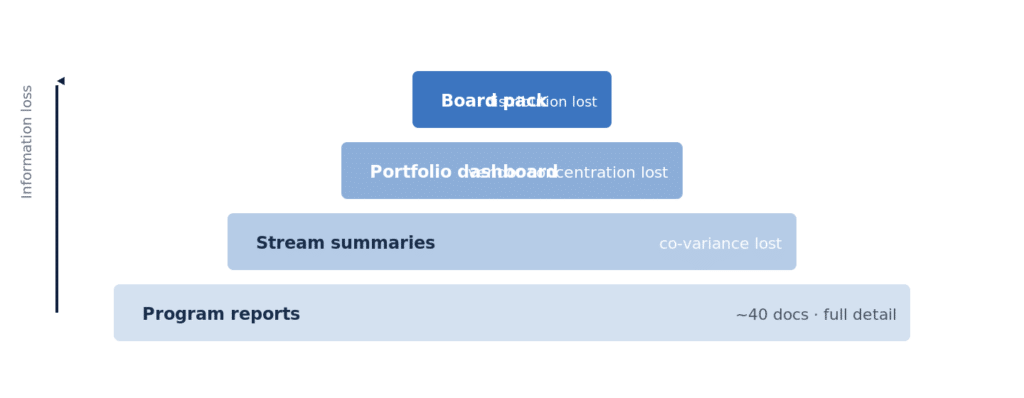
Figure 2. Information moves up through four compression layers between program reports and the board pack. Each layer removes a specific dimension of risk — co-variance, vendor concentration, and risk distribution — unless that dimension is explicitly preserved in the rollup design. Source: IT Delivery Assurance methodology, 2025.
What the board should be asking instead
Forrester Research (2023). Hidden losses in IT investment portfolios: a Fortune 1000 study. The study estimated that the average Fortune 1000 organization loses approximately $66M annually to IT investments that underperform their original business case — losses that are typically invisible at individual program level and surface only in aggregate portfolio analysis.
Flyvbjerg, B. & Budzier, A. (2022). Cost overruns and benefits shortfalls of IT projects. Saïd Business School, University of Oxford. The Oxford research found that IT projects exhibit roughly three times the cost variance of comparable capital infrastructure projects, with the variance driven primarily by long-tail “black swan” overruns that are rare per project but common at portfolio level — making portfolio-level oversight materially more important for IT than for other capital categories.
References
1. NACD & Deloitte Center for Board Effectiveness (2024). Board oversight of technology risk: a director survey.
2. Forrester Research (2023). Hidden losses in IT investment portfolios: a Fortune 1000 study.
3. Flyvbjerg, B. & Budzier, A. (2022). Cost overruns and benefits shortfalls of IT projects. Saïd Business School, University of Oxford.