Five signs a program status report is hiding more than it shows

Most status reports do not lie. They omit. They round. They smooth. By the time leadership realizes the report no longer matches the operational truth, the corrective options have narrowed — sometimes drastically. Learning to read between the lines is among the highest-leverage governance skills a senior executive can develop.

Shahid Qaisrani, PgMP, PMP

2026-05-09

five-signs
A status report is a compressed representation of operational reality. Like any compression, it discards information. The question that determines whether the report remains useful for governance is not whether it discards information — that is unavoidable — but whether the information being discarded is the information most relevant to the decisions in front of the steering committee. When the answer to that question shifts, the report becomes structurally misleading. It is still being produced in good faith. It is still being reviewed by senior leadership. But the gap between what it conveys and what is actually happening in the delivery has begun to widen. The patterns by which this gap widens are not random. There are recognisable signs that recur across organizations, sectors, and delivery methodologies. None of them is conclusive in isolation; any of them can be explained away in a single reporting cycle. But their persistence — and especially their combination — provides one of the most reliable early indicators that the formal reporting layer has lost contact with the operational layer.

17%

of large IT projects go so badly they threaten the existence of the company. In 80% of those cases the warning signs were visible in earlier status reports.
McKinsey & Company, 2023

27%

of digital transformations fail to meet original objectives, with leadership citing limited visibility into delivery health as a leading cause.
KPMG, 2023

70%

average budget overrun on IT projects, with one in six suffering a cost overrun exceeding 200% of the original baseline.
Flyvbjerg, Oxford Saïd, 2022

The signs that hide in the numbers

The first place narrative drift becomes detectable is in the structure of the data itself — what the report counts, how it summarizes, and what those summaries quietly leave out.


Sign 1 — the rolling risk register

When the same risks and unresolved actions appear cycle after cycle without being materially advanced, the register has shifted from being a corrective mechanism to being an archival one. Each entry continues to be reviewed, owners continue to be assigned, mitigations continue to be discussed — and the underlying condition continues to persist. The longer a risk remains on the register without resolution, the lower the probability that the existing governance arrangements will resolve it. This is not a function of the risk itself; it is a function of whether the governance mechanism is structurally capable of acting on it.

The diagnostic question: is not “what is on the register” but “what has come off the register, and how.” A healthy register has a steady throughput: risks added, risks worked, risks closed with evidence. A drifting register accumulates without discharging.
Sign 2 — the over-reliance on the RAG color

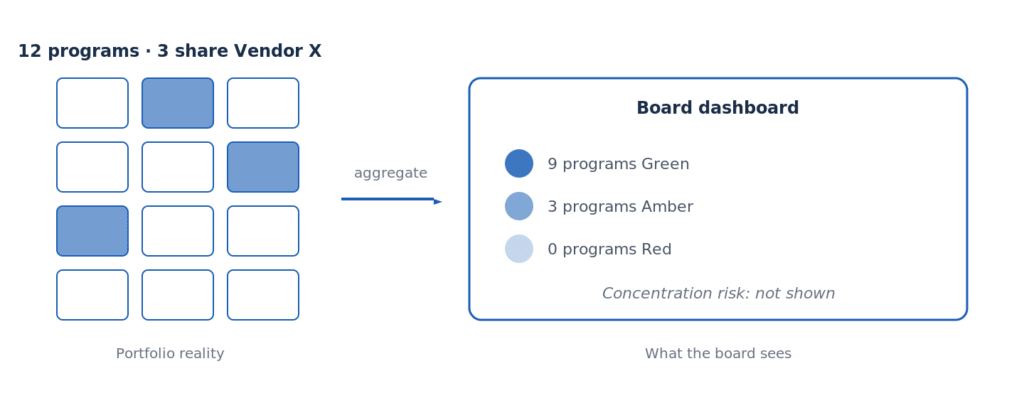
A red, amber, or green dashboard is a useful summary device for executives who do not have time to read forty pages of narrative. It is a destructive device when it begins to substitute for that narrative. The color is a compression of judgment. If the underlying judgment is being progressively softened — if “amber” begins to absorb conditions that would previously have prompted a red — the dashboard remains colored but no longer conveys the same meaning. The color layer has drifted from the data layer.
boards-miss_figure_1
Figure 1. Across six reporting cycles, the proportion of streams marked Green steadily rises while operational performance, measured independently, deteriorates. The color layer has decoupled from the data layer. Source: IT Delivery Assurance internal analysis, 2025.

"A status report that always reads green is not a sign of stable delivery. It is, more often, a sign of narrative consistency."

McKinsey & Company (2023). Delivering large-scale IT projects on time, on budget, and on value. Retrieved from mckinsey.com. The study found that in approximately 80% of cases where large IT projects entered crisis, warning signs were already visible in status reporting at least six months prior — but had not been escalated through governance.

The signs that hide in the structure

The next place narrative drift becomes detectable is in the structural integrity of the report itself — its dependency map, its milestone discipline, its cross-stream coherence.

Sign 3 — the missing dependency map

Status reports are workstream-shaped. Each delivery team or stream produces its slice. The composite picture is assembled centrally. What is frequently missing is the dependency map that links those slices together: when stream A reports “on track”, what is that dependent on from stream B; when stream B reports “amber on a known risk”, how does that risk propagate to stream A’s confidence rating. The absence of a maintained dependency map is the single most common structural defect in steering-committee reporting, and it produces a specific failure mode — composite green at the program level, composite red at the delivery level, with no formal mechanism to reconcile the two.

Sign 4 — the unchallenged milestone

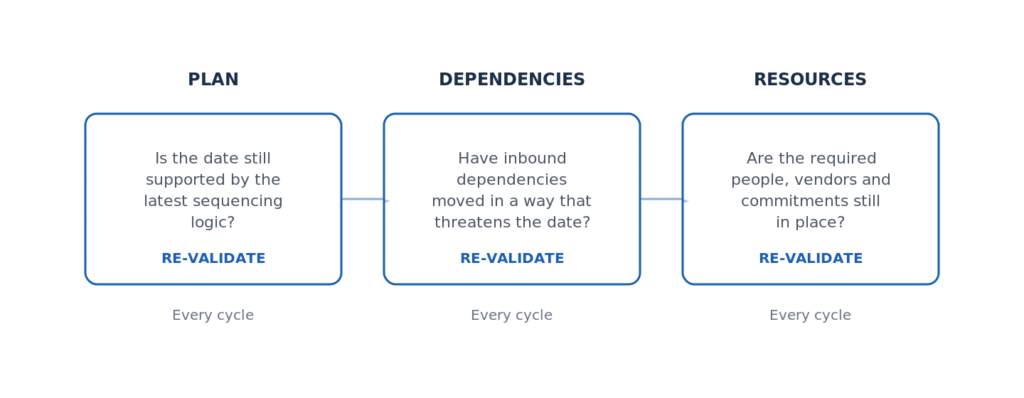
A milestone date appears in three consecutive reports without being re-validated against the latest plan, the latest dependency position, or the latest resource availability. The team is still working towards it. The date itself, however, has become an artefact — present in the report not because it has been re-confirmed but because it has not been formally re-baselined. Unchallenged milestones accumulate. By the time the steering committee asks the question “is this date still real”, the answer is frequently no — and has been no for several reporting cycles.
five-signs_figure_2
Figure 2. A milestone is only credible to the extent it has been re-tested against the current plan, dependencies, and resource position within the reporting cycle. Source: IT Delivery Assurance methodology, 2025.

The sign that hides in plain sight

KPMG (2023). Driving business performance through digital transformation. The report found that 70% of digital transformations fail to meet original objectives, with 56% of surveyed executives citing “limited visibility into actual delivery health” as a contributing factor.
Flyvbjerg, B. & Budzier, A. (2022). Cost overruns and benefits shortfalls of IT projects. Saïd Business School, University of Oxford. The 27% average overrun masks a long-tailed distribution: one in six projects suffers an overrun exceeding 200%, and these “black swan” projects account for the majority of aggregate IT investment loss.

References

1. McKinsey & Company (2023). Delivering large-scale IT projects on time, on budget, and on value. mckinsey.com
2. KPMG (2023). Driving business performance through digital transformation. KPMG Global.
3. Flyvbjerg, B. & Budzier, A. (2022). Cost overruns and benefits shortfalls of IT projects. Saïd Business School, University of Oxford.

Related insights

Continue reading

IT Delivery Assurance
9 min read
2026-05-09
IT Delivery Assurance
8 min read
2026-05-09